- McGill  University  
        School of Urban Planning


              1:  Introduction
                                    - Project scope, data sources, processing,
       and display
    Map 1.1
                                    - Orientation map
    Map 1.2
                                   - Highways and rail stations
    
    2: Permits
    
    Graph 2.1
                                  - All permit values
     Graph 2.2
                                 - Residential permit values
     Graph 2.3
                                 - Permit values by sector
     Graph 2.4
                                 - Total residential permits
     Map 2.5
                                 - Residential permits, 1958-1970
     Map 2.6
                                 - Residential permits, 1971-1982
     Map 2.7
                                 - Residential permits, 1983 -1994
     Map 2.8
                                 - Average permit value, 1958-1970
     Map 2.9
                                 - Average permit value, 1971-1982
     Map 2.10
                                 - Average permit value, 1983-1994
    
         3: Permit trends
    
    Graph 3.1
                               - Four cities
      Map 3.2
                              - North/south trends
      Graph 3.3
                              - North/south: Value of permits
      Graph 3.4
                              - North/south: Number of permits
    
          4: Population and dwellings
    - Census information
    Map 4.1
                              - Population increase 1951-1991
     Graph 4.2
                              - Population by city
     Graph 4.3
                              - Youth population
     Map 4.4
                              - Dwelling units by period of construction
    
          5: Analysis
    
    
          6:
   Conclusion
                            - Key observations
    
    Data sources


| Orientation Map | 
              Map  1.1 | 
        
|                             
       
                                   The cities of the West Island are shown
 in  bright    green    in  Map   1.1.   The    shoreline borders Rivière
   des   Prairies    along  the   north,   Lac des Deux Montagnes to the
west,    and   Lac Saint-Louis    to  the south. 
           | 


           | 
        
       
| 
                        Project scope This 
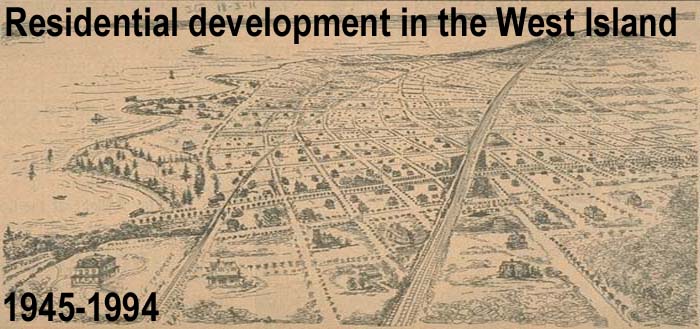
project examines residential development from 1945 to 1994 in the West Island area of suburban Montreal. As the name suggests, the thirteen cities (Lachine, Dorval, Pointe-Claire, Beaconsfield, Baie-d'Urfé, Sainte-Anne-de-Bellevue, Senneville, Pierrefonds, Île-Bizard, Sainte-Geneviève, Kirkland, Roxboro, and Dollard-des-Ormeaux) lie on the western end of Montreal Island. Through proposals considered on this site, a more comprehensive research project that explores the historical relationship between the development of this particular suburban form and the transportation networks that wove it together. The communities of the West Island have a long history as farming towns, rural parishes, and shoreline villages. At the initial period of European settlement, a chain of small forts and mills along the northern shore of Lac-Saint-Louis to provide secure redoubts for the relatively sparse agricultural population in case of attack. As part of this effort, five windmill-equipped forts were established along the southern edge of the West Island (Matthews 1985). The seigneurial system was based around control of the mill as the means of adding value to grain crops, and of the fur trade that operated along the Ottawa River (and to a lesser extent the Saint Lawrence). The subsequent period of agricultural development brought the gradual nucleation of rural settlements such as Sainte-Anne-de-Bellevue and Sainte-Genevi è ve along the periphery of the island (Marsan 1994). The construction of the Grand Trunk (later absorbed into the Canadian Pacific) railroad between 1852 and 1856 lured wealthy anglophones to build summer homes along or near the waterfront. The lakeside areas became resort communities, and eventually became sufficiently attractive that many families decided to winterize their summer homes and move permanently to the suburbs. The construction of McGill's Macdondald Campus during the early years of the twentieth century gave a stable employment base to the village of Sainte-Anne-de-Bellevue at the island's western tip. After the first World War, Autoroute 20 was built parallel to the CP tracks to supplement congested Lakeshore Boulevard with a more modern highway connection to Ontario. Development pulled inland to agricultural areas of Pointe-Claire somewhat, but it was not until the period after the second world war that a surge of suburban development radically transformed the sleepy towns (Friedman et al 2002: ch. 1). The construction of Autoroute 40 in the 1960s brought a wholesale reconfiguration of the West Island that is still going on today. Municipalities and the provincial government widened connecting roads and zoned swaths of land flanking the highway for substantial industrial and commercial use. With the growth of jet travel, Dorval Airport began to expand and draw aviation industries to its periphery. Thousands of new residents filled, and continue to fill, single-family homes. Regarded as the heart of Quebec's anglophone community, the cities of the West Island (now boroughs of the City of Montreal) form a national and international hub for the pharmaceutical, aerospace, and electronics industries. The physical development of the West Island, in all of its historical phases, been closely tied to the development of its transportation networks. This project is concerned more specifically with the effects of transportation networks on residential development after the second world war. The research presented below identifies and displays chronological trends in population growth and building permit value and number, as well as their geographic distribution. This allows us to establish an age profile of a municipality's housing stock, compare the pace and type of development in each, and group municipalities around roughly similar patterns of historical development. Given the age profile of the housing stock and its reliance on a relative monoculture of low-density single-family homes (Friedman et al 2002: ch. 5), some aspects of these trends and clusters are clearly tied to the development of Autoroutes 20 and 40. The current proejct stems from a desire to achieve a more sophisticated understanding of the scope of that influence. Potential avenues by which that research program could enable such an understanding are discussed in the Conclusion below. An earlier version of this site was prepared for a GIS course taught in the School of Urban Planning in the winter term of 2002. The research was supervised by Professor David Brown, who taught the course with Professor Madhav Badami. The author coordinated research into the history, pattern, and potential future of suburban development in the West Island for Professor Avi Friedman of the School of Architecture during the summer of 2002. The historical material added to the document is based on the research conducted by the author and his teammates and supervised by Professor Friedman. Professors Brown and Friedman are, with Professor Thom Meredith of the Department of Geography, engaged in a multi-year research effort to study built and natural environments in the West Island, funded by the Woodcock Foundation. The author's current project, adding additional historical information on and analysis of the development of the road network, is supervised by Professor Murtaza Haider. Data sources Building permits are recorded monthly by Statistics Canada, starting in 1922, as publication 64-002. Later on, annual totals were published as 64-203. These cover the number of residential building permits in selected municipalities, their value, and the values of industrial, commerical, and institutional permits. These figures are obtained directly from the relevant municipalities; there is no guarantee of uniformity in valuation among the different jurisdictions. Comlicating things somewhat, Statistics Canada did not publish this data between March 1947 and December 1956. Figures for some cities are available for the years 1951-1956, in publication 64-501. Dwelling and population information was published in the Census of Canada. Limited statistics are available at the level of individual municipalities, census tracts, or census subdivisions, and not all are provided for all years. Total population, percentage of the population under fourteen, and the decade of construction of dwelling units can be obtained, however, and are displayed below. A complete list of all data sources can be found below . Data processing and display Statistics Canada housing publications and Census tables are available in paper copies or on microfilm; individual figures had to be entered by hand and analyzed using Microsoft Access and Excel (the poor quality of the originals made the use of optical character recognition software unsuitable). Figures for permit value by sector, average permit value, and totals for various time periods were obtained by processing the raw data, also with Access and Excel. Permit values were adjusted to 2002 dollars using Bank of Canada figures and the convenient inflation calculator . Graphs were generated with Excel, maps with ESRI ArcMap. Graphics files were formatted and cleaned up with Adobe Illustrator and Photoshop, and this site was built using Netscape Composer.  | 
        
| Highways and rail stations | 
              Map  1.2 | 
        
|                             
       
                                   Autoroutes 40 and 20, indicated in the 
 lower    left   hand   corner    of  Map   1.2,  play a major role in the
 postwar   development     of  the West    Island. 
          A former Canadian Pacific commuter train line runs parallel to (and shares some right-of-way with) Autoroute 20. The former Canadian National line has stations in Roxboro and the eastern portion of Pierrefonds; its stops near Île-Bizard are located across the Rivière des Prairies in Laval and are relatively inaccessible to Île-Bizard residents. Stations along both lines are marked in blue.  | 


           | 
        
| 
                                   All  permit values | 
          
                 Graph 2.1 | 
        
| 
                                   Graph 2.1 shows the total value for  all 
  types    of  building     permits     in  the  West Island. The pattern 
is essentially      identical   to  that of  Graph   2.2, showing residential
  permit values    for the  same   period.
                   All values adjusted  for inflation to 2002. | 
           
           | 
        
| 
             Shortcut to the analysis
           | 
          
                                        Data source: Statistics Canada publications 
     64-002,     64-203 | 
        
| 
                                   Residential   permit values | 
          
              Graph  2.2 | 
        
| 
                       Graph 2.2 shows the total value of residential permits 
  in  all   cities.
                 All values   adjusted  for inflation to 2002. | 


           | 
        
| 
             Shortcut to the 
                      analysis
           | 
          Data source: Statistics Canada publications 64-002, 64-203 | 
| 
                                   Permit  values  by sector | 
          
                 Graph 2.3 | 
        
| 
                                   Graph 2.3 shows each sector's percentage 
 of  the  total value of all types of permits for new construction in  all 
   cities.  | 
           
           | 
        
| 
             Shortcut to the 
                      analysis
           | 
          
                                        Data source: Statistics Canada publications 
     64-002,     64-203 | 
        
| Total residential permits | 
              Graph  2.4 | 
        
| 
                                   Graph 2.4 shows the total number of  residential 
     permits     for   all   cities. Only the years in which data for all
    cities is   available  are shown. | 
           
           | 
        
| 
             Shortcut to the 
                      analysis
           | 
          Data source: Statistics Canada publications 64-D-22, 64-501, 64-002, 64-203 | 
| 
                                   Residential permits, 1958-1970 | 
          
              Map  2.5 | 
        
| 
                                    Map 2.5 shows total residential permits 
 per   square    kilometer     for the period 1958-1970. Adjusting for the 
 relative   sizes   of the different     cities helps clarify trends for different
 periods    . | 
           
           | 
        
| 
             Shortcut to the 
                      analysis
           | 
          Data source: Statistics Canada publications 64-002, 64-203 | 
| 
                                   Residential  permits, 1971-1982 | 
          
              Map  2.6 | 
        
| 
                                    Map 2.6 shows total residential permits 
 per   square    kilometer     for the period 1971-1982. This figure was obtained
   by       dividing  the   total residential permits for each city
by   the surface   area of that  city. | 
           
           | 
        
| 
             Shortcut to the 
                      analysis
           | 
          Data source: Statistics Canada publication 64-203 | 
| 
                                   Residential permits, 1983-1994 | 
          
              Map  2.7 | 
        
| 
                                    Map 2.7 shows total residential permits 
 per   square    kilometer     for the period 1983-1994. This figure was obtained
   by       dividing  the   total residential permits for each city
by   the surface   area of that  city. | 
           
           | 
        
| 
             Shortcut to the 
                      analysis
           | 
          Data source: Statistics Canada publication 64-203 | 
| 
                                   Average permit value, 1958-1970 | 
          
              Map  2.8 | 
        
| 
                                    Map 2.8 shows an "average average permit
  value"    for   each   city   in  the   1958-1970   period, computed by
averaging   the  average   permit   value   for every year   during the period.
      
                      All values adjusted for inflation to 2002. | 
           
           | 
        
| 
             Shortcut to the 
                      analysis
           | 
          Data source: Statistics Canada publications 64-002, 64-203 | 
| 
                                   Average permit value, 1971-1982 | 
          
              Map  2.9 | 
        
| 
                                    Map 2.9 shows an "average average permit
  value"    for   each   city   in  the   1971-1982   period, computed by
averaging   the  average   permit   value   for every year   during the period.
      
                      All values adjusted for inflation to 2002. | 
           
           | 
        
| 
             Shortcut to the 
                      analysis
           | 
          Data source: Statistics Canada publication 64-203 | 
| 
                                   Average permit value, 1983-1994 | 
          
              Table  2.10 | 
        
| 
                                    Map 2.10 shows an "average average permit 
  value"    for   each   city   in  the   1983-1994   period, computed by 
averaging   the  average   permit   value   for every year   during the period. 
      
                      All values adjusted for inflation to 2002. | 
           
           | 
        
| 
             Shortcut to the 
                      analysis
           | 
          Data source: Statistics Canada publication 64-203 | 
| 
                                   Four cities | 
          
                 Graph 3.1 | 
        
| 
                                   Graph 3.1 shows the distribution of  residential 
     building     permits     between    1945 and 1994.  Two cities, Lachine and Dorval, lead residential development in the fifties. After 1962, Pierrefonds and Dollard-des-Ormeaux emerge as growth leaders .  | 
           
                                     | 
        
| 
             Shortcut to the 
                      analysis
           | 
          Data source: Statistics Canada publications 64-D-22, 64-501, 64-002, 64-203 | 
| North/south trends | 
              Map  3.2 | 
        
| 
                     Map 3.2 describes the "northern"  and     "southern" 
tiers    of  cities.     Trends  involving these two categories  are described 
     in  graphs 3.3    and 3.4. | 
           
           | 
        
| 
                                       North/
 south            :  Value    of  permits | 
          
              Graph  3.3 | 
        
| 
                     Graph 3.3 shows the total value of residential permits 
 for   the   northern     (shown in red) and southern (shown in blue) tiers 
 of cities. | 
           
                                      | 
        
| 
             Shortcut to the 
                      analysis
           | 
          Data source: Statistics Canada publications 64-501, 64-002, 64-203 | 
| 
                                       North/
 south
                   : Number of permits | 
          
              Graph  3.4 | 
        
| 
                   Graph 3.4 shows the total number of residential permits
 for   the   northern     (shown in red) and southern (shown in blue) tiers
 of cities. | 
           
           | 
        
| 
             Shortcut to the 
                      analysis
           | 
          Data source: Statistics Canada publications 64-D-22, 64-501, 64-002, 64-203 | 
| 
                                   Population  increase 1951-1991 | 
          
              Map  4.1 | 
        
| 
                                   Map 4.1 shows the total percentage population
     increase     between     1951   and   1991 for each city. Dollard-des-Ormeaux is both literally and figuratively in a category by itself; its increase of 14,709 percent dwarfs the next largest increase (Pierrefonds', at 3,686).  | 
           
                 | 
        
| 
             Shortcut to the 
                      analysis
           | 
          Data source: Census of Canada, 1951-1991 | 
| 
                                   Population   by city | 
          
              Graph        4.2 | 
        
| 
                                   Patterns of population growth tend to
fall   into   four   categories,    shown in Graph 4.2.  | 
           
           | 
        
| 
             Shortcut to the 
                      analysis
           | 
          Data source: Census of Canada, 1951-1991 | 
| 
                                   Youth   population | 
          
                 Graph 4.3 | 
        
| 
                     Graph 4.3 shows the percentage of the population fourteen
   and   under    for   each of the cities. This is one indicator of the
changing     demographic    importance   of young families in the various
cities over    the study period. | 
           
     | 
        
| 
             Shortcut to the 
                      analysis
           | 
          Data source: Census of Canada, 1951-1991 | 
| 
                                   Dwelling units by period of construction
                                       
                         Map 4.4 | 


            | 
        
| 
                                       Data source: Census of Canada, 1991 | 
        
| 
          Graph 2.3
                        indicates a relatively stable distribution between
 different      sectors     of  construction. The construction of new housing
       consistently      dominates            throughout the study
period.   that of industrial,      commercial,  and   institutional   buildngs
in the West Island. The one    exception  to this  rule--a   slump in the
 share of residential  values   in 1968 and  1969--came  during  years when
total permit values increased   (see Graph           2.1
          ), and seem to be due to an influx of  industrial facilities (most
    likely      as a result of the construction of Autoroute 40). Two development "spikes" are visible: one in the late seventies and one in the late eighties and early nineties. The first spike is somewhat ambiguous; Graphs 2.4 and and 3.4 alternately suggest that it is confined to a single year and the culmination of several years of growth. The second spike is quite clear on all of the various graphs; Graphs 2.2 and 2.4 show an extraordinary increase in both the number and value of housing permits, while Graph 3.1 3.3 and 3.4 do indicate, however, that this boom was concentrated in the northern tier. Maps 2.5 , 2.6 , and 2.7 show development becoming more centered in the north-central cities of the area. The process is chiefly driven by Pierrefonds and Dollard-des-Ormeaux. Maps 2.8 , 2.9 , and 2.10 show average residential permit values for different time periods. This figure was calcutated by dividing the total value of all residential permits by the total number of residential permits for each year, and then calculating the average of that number for the time period. Most cities show varying permit values for different periods, though the cities at the western tip of the island tend to higher average values. Graph 4.2 shows the population of each city between 1951 and 1991. Four general patterns of growth can be readily identified. Île-Bizard and Kirkland only start growing in the late sixties, but their populations increase consistently afterwards. Pierrefonds and Dollard-des-Ormeaux grow the fastest of all municipalities until the mid-seventies, after which their growth rates slow somewhat. The populations of Dorval, Pointe-Claire, Lachine, and Beaconsfield all increase briskly until 1971, after which they stabilize (or, in Lachine, decline considerably). The smaller cities of Sainte-Anne, Sainte-Geneviève, Baie-d'Urfé, Senneville, and Roxboro all show modest and stable growth throughout the study period. Graph 4.3 , showing the percentage of the population aged fourteen or less, gives an indication of the changing demographic importance of young families in the population structure of the West Island. The north/south differences noticed earlier are generally borne out by this data as well. The southern-tier cities took part in the rise of the youth population during the fifties, but began to decline even while northern-tier cities maintained high proportions of children in the early sixties. Map 4.4 demonstrates that cities otherwise similar in their size, patterns of population growth, and permit trends were, in fact, built at different times. Though parts of the same place and morphologically similar, the cities of the West Island differ markedly in the vintage of their housing stock.  | 
        
          Initial observations


 Initial observations focused on identifying typical patterns of growth among cities and advancing preliminary, rather speculative, explanations as to the connection between the spatial distribution, intensity, and type of development and the construction of the two main highways. Taking this research to the next step will involve processing and analyzing additional data concerning the housing types built in the West Island during the postwar period, as well as developing a better understanding of the construction of Autoroutes 20 and 40 and the upgrading of the major access roads (Saint-Charles, Saint John's Road, and boulevard des Sources). The research and analysis that will further this effort is detailed below. 
 
 
  | 
        
| 
                    Source name | 
          
                    Years used | 
          
                    Frequency | 
          
                    Tables used | 
        
| 
          Housing Statistics (64-D-22) | 
          
          1945-1947 | 
          
          Annual | 
          
          Table VI | 
        
| 
          Building Permits (64-001) | 
          
          1957-1964 | 
          
          Monthly | 
          
          Table 5 | 
        
| 
          Building Permits, 1951-1956 (64-501) | 
          
          1957 | 
          
          Occasional | 
          
          Quebec | 
        
| 
          Building Permits (64-203) | 
          
          1967-1994 | 
          
          Annual | 
          
          Tables 5, 10, 11 | 
        
| 
                    Year | 
          
                    Publication number | 
          
                    Name or number of table(s) used | 
        
| 
          1951 | 
          
          98-1951-M5 | 
          
          Tables 1, 2, 3, 6, 23 | 
        
| 
          1956 | 
          
          95-505 | 
          
          Population, household, and family characteristics, by census tracts, 
   Montreal       Metropolitan Area, 1956 | 
        
| 
          1961 | 
          
          95-519 | 
          
          Tables 1, 2, 3 | 
        
| 
          1966 | 
          
          95-604 | 
          
          Population, household, and family characteristics by census tracts,
   Census       Metropolitan area of Montreal, 1966 | 
        
| 
          1971 | 
          
          95-704 | 
          
          Tables 1, 2, 3 | 
        
| 
          1976 | 
          
          95-811 | 
          
          General population, housing, household, family, and labour force
 data    for      census tracts | 
        
| 
          1981 | 
          
          95-918 | 
          
          Table 1 | 
        
| 
          1986 | 
          
          94-110 | 
          
          Selected characteristics for census divisions and census subdivisions, 
    1986   Census | 
        
| 
          1991 | 
          
          95-325 | 
          
          Table 1 | 
        
| 
          Inflation Calculator - Bank of Canada <
                   http://www.bankofcanada.ca/en/inflation_calc.htm
                   >. Accessed April 11th, 12th, and 13th, 2002 | 
        
| 
         "This magnificent expanse of territory along the northern shores 
of  Lake      St. Louis will in a few years be one of Montreal's loveliest 
residential       suburbs" <
   http://www.bnquebec.ca/massic/accueil.htm
                   >. Albums de rues E.-Z. Massicotte, Bibliothèque 
  Nationale      du  Québec. Accessed April 7, 2002. Friedman, Avi et al (2002). Vision 20/20: Common Sense Communities for Montreal's West Island. Montreal: McGill University School of Architecture. Marsan, Jean-Claude (1994). Montréal en Évolution . Montreal: Éditions du Méridien. Matthews R., Brian (1985). A History of Pointe-Claire . Pointe-Claire: Brianor.  |